Experiment 1 - Net Force and Acceleration
Research Question - What effect does changing the NET FORCE on a system have on the acceleration of the system???
Independent Variable - the NET FORCE acting on the system
Dependent Variable - ACCELERATION
Controls - TOTAL MASS of the system, other parts of the system including the hanger, the track and the cart
- Why do we have to keep the total mass constant? How do we do this properly?
The more mass an object has, the more inertia it has and the more resistance to change in motion (acceleration) it has. This means we need to keep it the same. We will change the net force by MOVING mass from the cart to the hanger instead of ADDING them.
Procedures
#1 Measure the mass of our system (cart, string hanger, all of the hanging masses, etc.)
#2 Connect a motion sensor to LoggerPro to collect motion data (Velocity V.S. Time graph)
#3 Record the total mass of the hanger (or net force) and release the cart from rest while the motion sensor is collecting data
#4 Record the acceleration by calculating the slope of the resulting Velocity V.S. Time Graph
#5 Repeat step #3 to #4 for different hanging masses
Lab Set Up
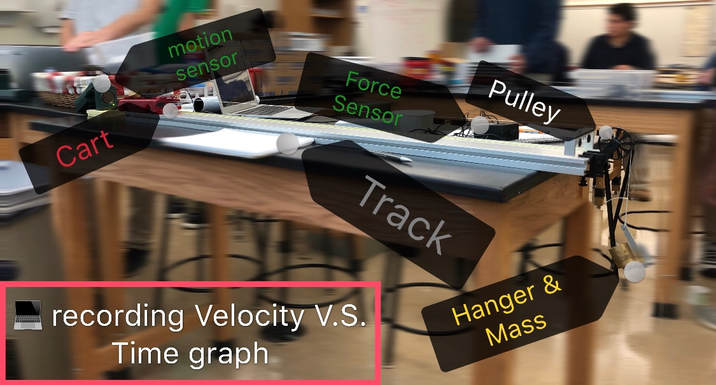
Lab Set-Up for Experiment 1
Raw Data
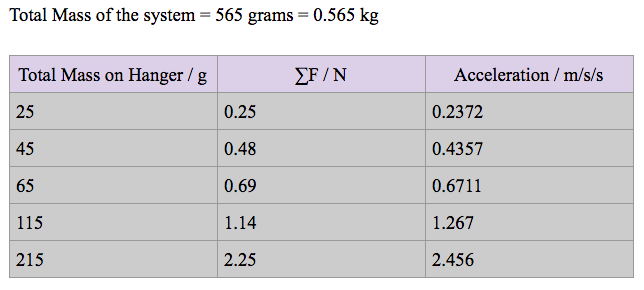
Processed Data
We plagued in the data points we recorded into LoggerPro and found the best fit model for the data points.
We plagued in the data points we recorded into LoggerPro and found the best fit model for the data points.
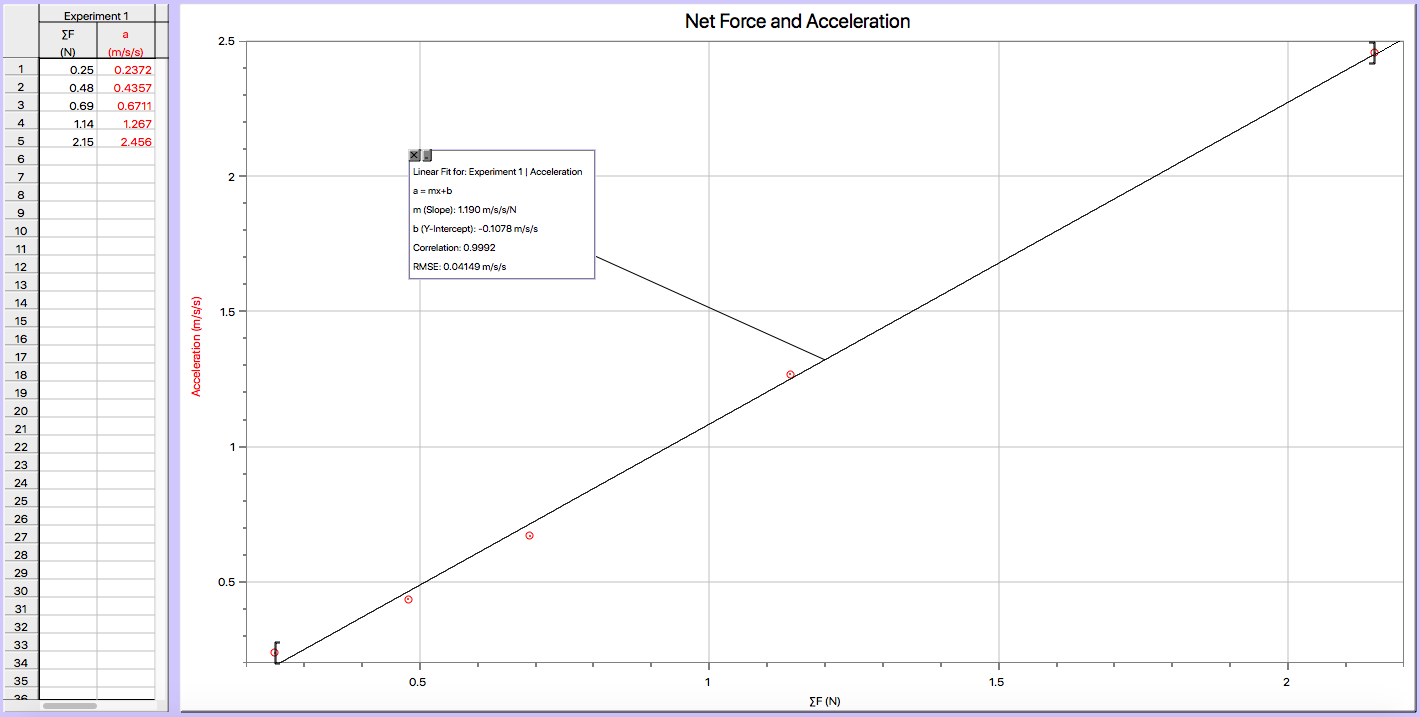
Best Fit Graph (by LoggerPro)
Mathematical Model
This is clearly a linear fit, which means that Acceleration is directly proportional to ∑F.
Equation - Acceleration = 1.190m/s/s/N * ∑F -0.1078m/s/s
Slope - All linear fits have a constant slope, and in this case the slope=1.190 m/s/s. To interpret the slope, we can say that for every Newton of increase in ∑F, the acceleration increase by 1.190 m/s/s.
Y-Intercept - In the graph, the y-intercept is -0.1078 m/s/s, which tells us that when the ∑F is 0N, the acceleration of the cart will be -0.1078 m/s/s.
This y-intercept value doesn't really make sense here. Logically, the y-intercept should be equal to 0 m/s/s in this case, because when ∑F=0 N, the only forces acting on the cart will be Fg and Fn, no third push or pull is acting on the cart, therefore the cart is supposed to be moving in a constant velocity with zero acceleration. With the y-intercept not equals to 0 m/s/s, it tells us that there are uncertainties involved in the process of the experiment.
Uncertainties - One source of uncertainty in this experiment was the range of the data. Due to the time limit, we only got to collect 5 data points. The range of the data set was definitely not big enough for this experiment. Another source of uncertainty was the Fg of the hanger measured by the force sensor (also the ∑F in this case). When we were reading the force measured from the force sensor, the value kept changing back and forth, sometimes the values varies in a pretty big interval. We tried our best to average the overall measurement, but it is very likely that the force we recorded was not as accurate.
Improving the Investigation - With the sources of uncertainty being said in the previous section, I think one thing we need to do to improve the investigation is to collect a larger range of data. It is always beneficial to have a bigger collection of data, so we can fit the model much accurately. Another improvement we can do is to measure and record the mass on the hanger, and calculate the ∑F of the system (which equals Fg acting on the hanger) using the gravitational force equation: ∑F=Fg=mg. (Why does Fg acting on the hanger = ∑F acting on the system? )
Sample calculation:
∑F = Fg = 0.065 kg * 9.8 N/kg = 0.637 N
Compare to the force we recorded from the force sensor, which was 0.69 N, we just improved the accuracy of our data by 0.053 N, which is a big deal in a experiment like this, because the data/numbers are not big at all.
Experiment 2 - Mass and Acceleration
Research Question - What effect does changing the TOTAL MASS acting on a system have on the acceleration of the system?
Independent Variable - the TOTAL MASS acting on the system
Dependent Variable - ACCELERATION
Controls - NET FORCE of the system, other parts of the system including the hanger, the track and the cart
- Why do we have to keep the net force constant? How do we do this properly?
We expect that the net force will affect the acceleration. The net force will be determined by the amount of mass added to the hanger. This must remain constant. We can then change the mass by adding mass directly to the cart.
Procedures
#1 Measure the mass of the hanger (or Net Force)
#2 Connect a motion sensor to LoggerPro to collect motion data (Velocity V.S. Time graph)
#3 Record the total mass of the system and release the cart from rest while the motion sensor is collecting data
#4 Record the acceleration by calculating the slope of the resulting Velocity V.S. Time Graph
#5 Repeat step #3 to #4 for different system masses
Lab Set-Up
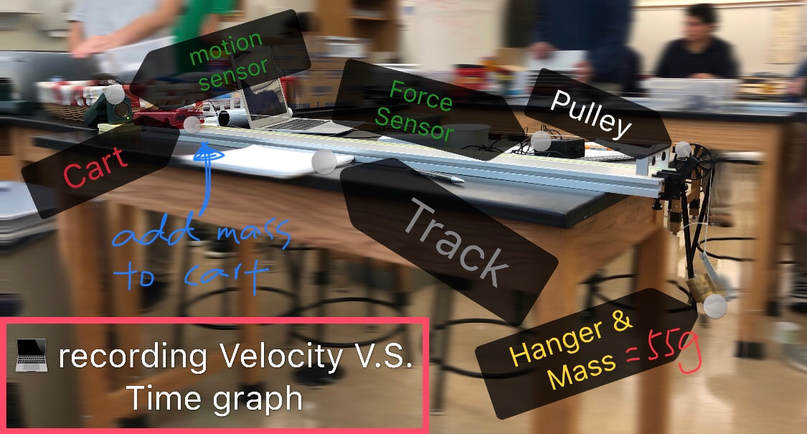
Lab Set-Up for Experiment 2
Raw Data
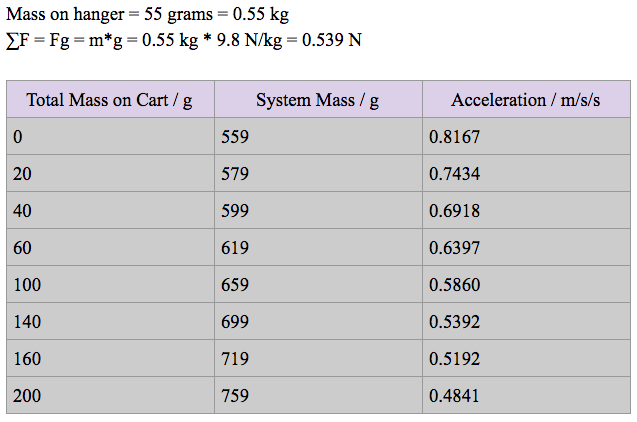
Processed Data
We plagued in the data points we recorded into LoggerPro and found the best logically fit model for the data points.
We plagued in the data points we recorded into LoggerPro and found the best logically fit model for the data points.
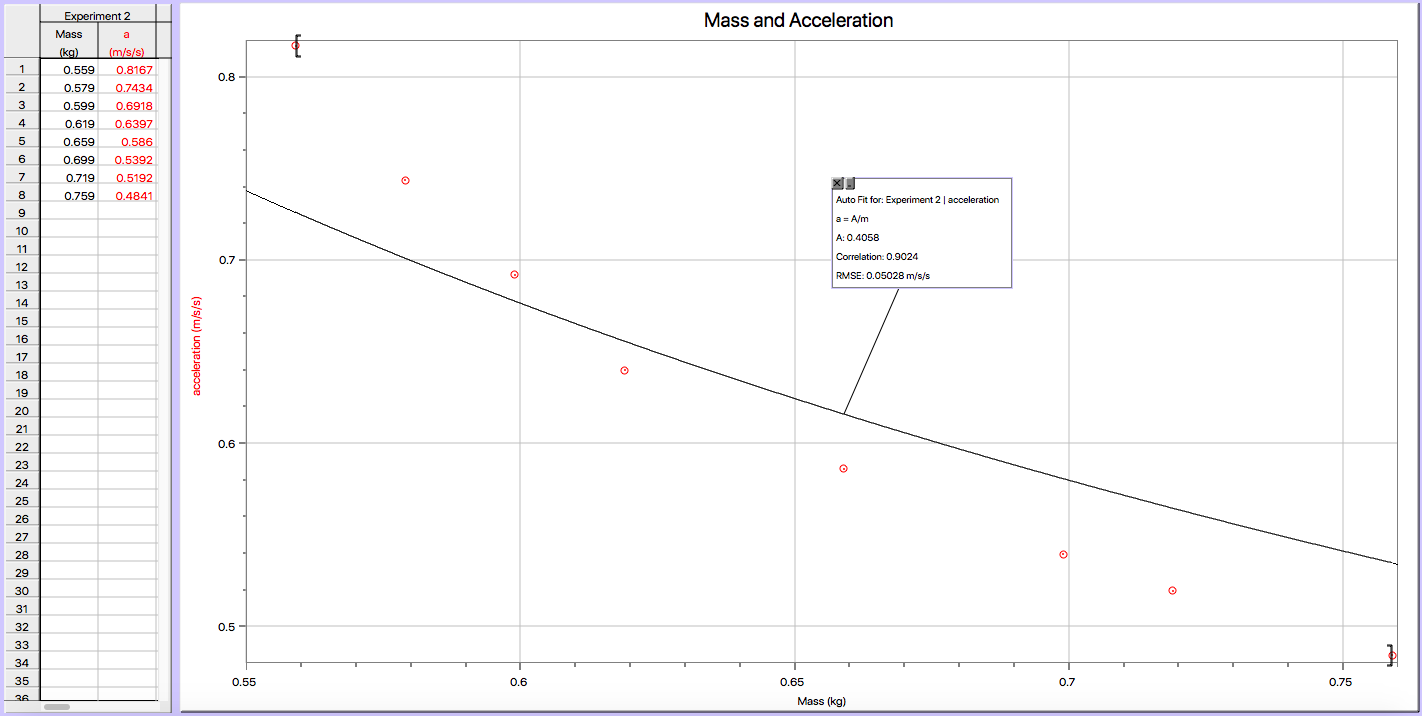
Best Fit Graph (by LoggerPro)
Mathematical Model
For this experiment, we found that the inverse model fits the data points the best, which means that Acceleration is inversely proportional to total mass.
(I know the data points look like a linear fit but... Why not Linear? )
Equation - Acceleration = 0.4058 kg*m/s/s / Mass
Slope - The inverse model does not have a constant slope. However, we can still interpret the slope by looking at the graph: As the Total Mass of the system increases, the acceleration decreases by less and less.
Y-Intercept - In this particular experiment, there isn't any y-intercepts, because it is impossible for Mass to be 0 kg (no object weighs nothing).
(For more specific explanation, click "Why not Linear?")
Uncertainties - Same as Experiment 1, the range of data was a source of uncertainty again. With the very limited data points we collected, it is very hard to actually model the inverse relationship accurately because the change in slope is not quite obvious in with this amount of data; this is also why our graph looks like a linear fit. Another uncertainty was air resistance. Air resistance is hard to reduce when doing the experiment, however, the force applied on the cart by air does play a role in every single trial.
Improve the Investigation - One way to improve our accuracy is, again, collect a wider range of data. If we do so, I believe the inverse relationship will shoes up more obvious instead of looking like a linear relationship. We can probably also improve the experiment by setting up with a greater ∑F, meaning we put maybe a 100 g mass (plus the hanger itself, which weighs 5 grams) on the hanger and make the ∑F = Fg = 0.15kg * 9.8 N/kg = 1.47 N, instead of 0.55 N. I think the decrease both velocity and acceleration will be much more obvious this way.
Conclusion
After all, both of these experiments helped us to prove Newton's Second Law of motion. This law pertains to the behavior of objects for which all existing forces are NOT balanced, which were the cases in our experiments. By graphing the collected data, we can confidently conclude that the acceleration of an object is dependent upon two variables - the Net Force acting on upon the object and the Mass of the object. According to Experiment 1, the linear model proves to us that the acceleration of an object depends directly upon the net force acting upon the object; and according to the inverse model presented in Experiment 2, we proved that the acceleration of an object depends inversely upon the mass of the object. As the force acting upon an object is increased, the acceleration of the object is increased. As the mass of an object is increased, the acceleration of the object is decreased.
Newton's Second Law seems very powerful to me, because it connects acceleration with mass and forces. Since both kinematics and forces are included in the equation ∑F=m*a, Newton's Second Law serves as a bridge between the Unit 1 and Unit 2 and ties them together. (which is for sure going to make the problems much harder👍).
