Research Question - How has the position of the cart been affected by time on an incline?
DESIGN |
|
Independent Variable the amount of time the cart travels
Dependent Variable the distance the cart travels
Controls the type of cart, the surface of the track, and the incline of the ramp (10.5cm at the top)
The Controlling Variables
We decided to keep the type of cart and the surface of the track as constants because we think that different surface of the track and the cart's wheels can give very different amount of fraction, which will affect the speed the cart travels in general. We also decided to set the height of the ramp's incline as a constant because different steepness can result in different acceleration of the cart and other variabilities.
Data Collection
For this particular lab, we collected data in 2 different ways to improve our confidence in the results, which including
Motion Sensor and Video Analysis
Different ways of collecting data require different lab set-ups and procedures. Our procedures and results of both methods are listed below.
Motion Sensor
Procedures
#1 Connect the motion sensor to the LabQuest mini, and connect the LabQuest mini to the computer and open LoggerPro
#2 Place the motion sensor at the bottom of the track
#3 Let the cart run for a very short amount of time on the track and then tart the motion sensor on Logger Pro
#4 Let the cart run down the ramp and stop the cart right before it hits the motion sensor
#5 Stop the motion sensor before stopping the cart
Lab Set-up
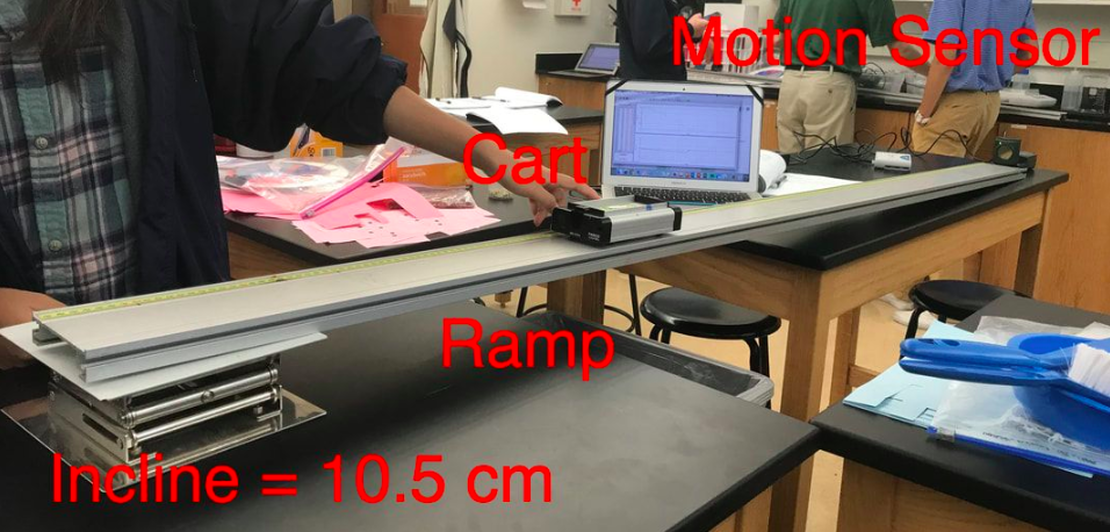
Lab set-up for data collection using motion sensor
Raw Data and Graphs
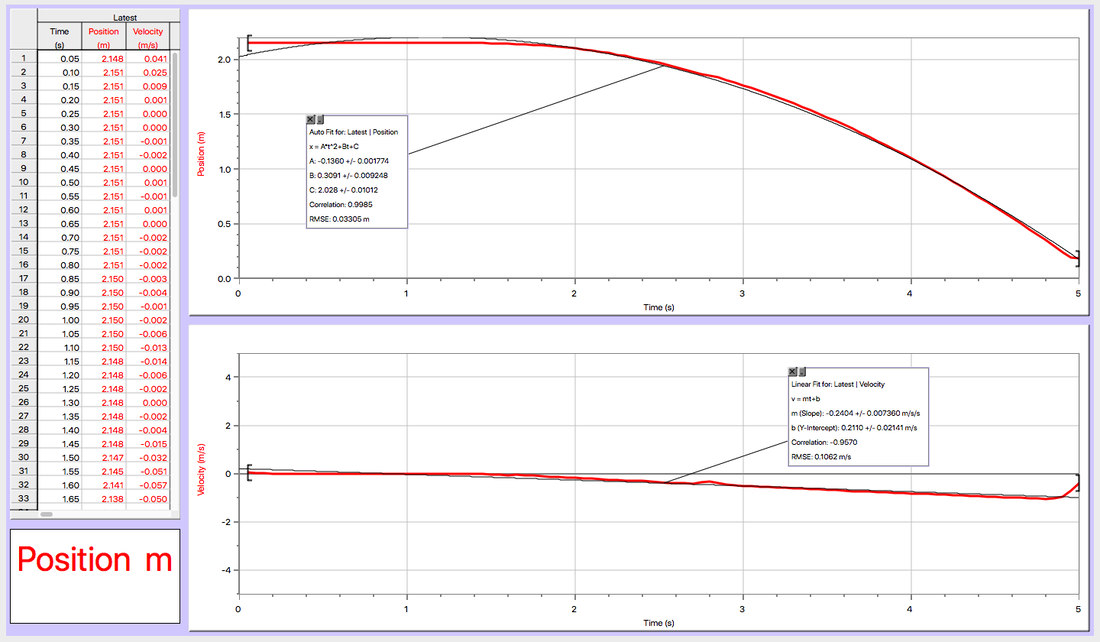
Graph of data collected using a motion sensor by LoggerPro
Position V.S. Time Graph
As presented above, the position v.s. time graph shows a strong decreasing quadratic relationship. Since we placed the motion sensor at the bottom of the ramp, our cart is moving closer and closer to the motion sensor(origin), therefore, the slope of the graph is negative for all intervals of the graph. The y-intercept is not 0 meters but 2.028 meters because when we started the motion sensor, our cart was at the top of the ramp, which was 2.028 meters away from the motion sensor at the bottom.
Equation:
Position(m) = -0.1360 m/s/s * Time^2 + 0.3091 m/s * Time + 2.028 m
Slope = inconstant/changing velocity
Velocity V.S. Time Graph
The velocity v.s. time graphs shows an obvious negative linear relationship.
Equation:
Velocity (m/s) = -0.2404 m/s * Time + 0.2110 m/s
Slope = Acceleration = -0.2404 meters/second/second
As presented above, the position v.s. time graph shows a strong decreasing quadratic relationship. Since we placed the motion sensor at the bottom of the ramp, our cart is moving closer and closer to the motion sensor(origin), therefore, the slope of the graph is negative for all intervals of the graph. The y-intercept is not 0 meters but 2.028 meters because when we started the motion sensor, our cart was at the top of the ramp, which was 2.028 meters away from the motion sensor at the bottom.
Equation:
Position(m) = -0.1360 m/s/s * Time^2 + 0.3091 m/s * Time + 2.028 m
Slope = inconstant/changing velocity
- As time increases, the cart's position decreases, and its speed get faster and faster. The position of the cart decreases because the cart is traveling in a negative direction towards the origin where the motion sensor is placed. The slope of the graph gets steeper and steeper, which indicates that the speed of the cart is getting greater and greater.
- When we started the motion sensor on Logger Pro, the cart was 2.028 meters away from the motion sensor at the bottom of the ramp.
Velocity V.S. Time Graph
The velocity v.s. time graphs shows an obvious negative linear relationship.
Equation:
Velocity (m/s) = -0.2404 m/s * Time + 0.2110 m/s
Slope = Acceleration = -0.2404 meters/second/second
- The cart has a constant negative acceleration equals to -0.2404 m/s/s. For each second of increase in time, the velocity of the cart decreases by 0.2404 meters/second. The acceleration is negative because the cart is speeding up and moving towards the origin.
- The velocity of the cart when we started the motion sensor was 0.2110 meters/seconds.
- This doesn't really make sense in this case because since the cart is always traveling in a negative direction, the velocity should never be positive at any point of time. Therefore, this can be considered as a major error of this lab.
Video Analysis
Procedures
#1 Set up the camera to look at a side of the buggy so it moves across the screen from left to right
#2 Include a meterstick in the frame so we can scale the video analysis later
#3 Record a video of the buggy running across the screen on the ramp
#4 Save the video and import it to computer
#5 Use LoggerPro to run a video analysis
Recorded Video
Below shows the video that is going to be analyzed
Raw Data, Graphs, and Analysis
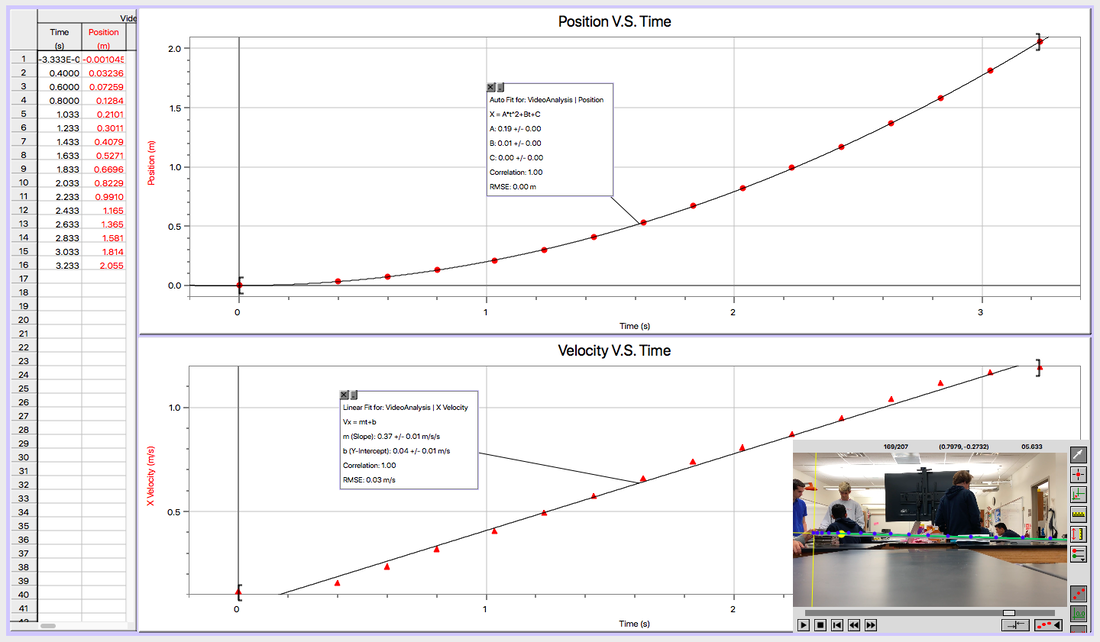
Graph of the collected data using video analysis on Logger Pro
Position V.S. Time Graph
Same as the graph we got using a motion sensor, the position v.s. time graph shows a clear quadratic relationship. Different from the previous graph, this time our graph has a positive increasing slope going up.
Equation:
Position(m) = 0.19 m/s * Time^2 + 0.01 m/s * Time
Slope = inconstant/changing velocity
Velocity V.S. Time Graph
Same as the graph from the motion sensor, the velocity v.s. time graphs shows a strong linear relationship. On the contrary, the slope of this graph is positive and this entire graph is above x-axis.
Equation:
Velocity (m/s) = 0.37 m/s/s * Time + 0.04 m/s
Slope = Acceleration = 0.37 meters/second/second
Same as the graph we got using a motion sensor, the position v.s. time graph shows a clear quadratic relationship. Different from the previous graph, this time our graph has a positive increasing slope going up.
Equation:
Position(m) = 0.19 m/s * Time^2 + 0.01 m/s * Time
Slope = inconstant/changing velocity
- As time increases, the cart's position increases as well. Indicated by the steepness of the slope, the cart's speed get faster and faster. Since this time I set the origin/starting point on the top of the ramp, the cart is moving in a positive direction, so our slope here stays positive all the time. In this particular case, our slope means that for each second of increase in time, the increase of the position of the cart gets bigger and bigger.
- As the y-intercept indicates, the initial position of the cart is 0.00 meters.
- This data is actually very accurate because we wanted our cart to start at position=0 meters. This is partially because when I was doing the video analysis on Logger Pro, I can adjust the origin myself and make the error as small as possible.
Velocity V.S. Time Graph
Same as the graph from the motion sensor, the velocity v.s. time graphs shows a strong linear relationship. On the contrary, the slope of this graph is positive and this entire graph is above x-axis.
Equation:
Velocity (m/s) = 0.37 m/s/s * Time + 0.04 m/s
Slope = Acceleration = 0.37 meters/second/second
- The cart has a constant positive acceleration of 0.37 m/s/s, which means for each second of increase in time, the velocity of the cart increases by 0.37meters/second. The acceleration is positive this time because the cart is speeding up and moving in a positive direction, meaning away from the origin.
- The velocity of the cart when we started to record the video was 0.04 meters/seconds.
- This set of data makes more sense regarding to the direction and the motion of the cart in general.
Conclusion
- According to both experiments and analysis, we can confidently conclude that when a cart is traveling down a ramp, it gradually speed up and experience an uniform acceleration.
- Both Position V.S. Time graphs turned out to present a quadratic model, and both slopes are getting steeper and steeper, which indicates that the cart was speeding up during both experiments. Due to the different lab set-ups, the absolute value of the slopes of the position v.s. time graphs are fairly similar to each other(0.1360 m/s and 0.19 m/s).
- Both Velocity V.S. Time graphs turned out to fit in a linear model, and both graphs indicate that the cart is speeding up over the entire time interval while experiencing an uniform acceleration. However, the absolute values of slopes for velocity v.s. time graphs were not very close to each other (0.37m/s/s and 0.2404m/s/s)
- The only difference between the two models was direction. For the motion sensor experiment, we set the origin at the bottom of the ramp, so the cart is moving towards the origin in a negative direction. On the other hand, when I was doing video analysis, I set the origin at the top of the ramp, so the cart is moving away from the origin in a positive direction. This doesn't really affect the result since we can always clarify the direction of the cart, and we can always analyze the motion of the cart from two different perspectives.
Evaluating the Procedures and Uncertainties
Compare the equations resulted from both methods, I think video analysis is a more accurate way to collect data than the motion sensor, even though motion sensor requires less time. This is because when I'm analyzing the video on the program, I have the ability to set many values myself, including the origin, the time, and the points when data are collected and therefore eliminate the uncertainties. On the other hand, we are not able to delete any extra point on the graph generated by the motion sensor, but video analysis enables us to have a wider and more flexible range of data.
Improving the Investigation
I think one way to improve our investigation is to set the ramp higher and get a longer tracker. This way, we will have a wider range of data to be analyzed. So the speeding up process won't be too short and we can collect more data points using either a motion sensor or video analysis.
