In this lab, we are trying to verify the validity of the following concepts of Momentum that we have discussed in this unit:
- Momentum is a conserved quantity
- In this lab, there are no external forces acting on our systems, which means Impulse (J) = 0 kg*m/s
- Therefore, our ultimate goal in each scenario is to prove pi = pf
- Momentum can be modeled using bar charts
- Bouncy Collision (one moving, one stationary)
- Bouncy Collision (both moving)
- Sticky Collision (one moving, one stationary)
- sticky collision (both moving)
- Explosion (Neither is moving, then both are moving)
Scenario 1 - Bouncy Collision (one moving, one stationary)
Set-up
Set-up
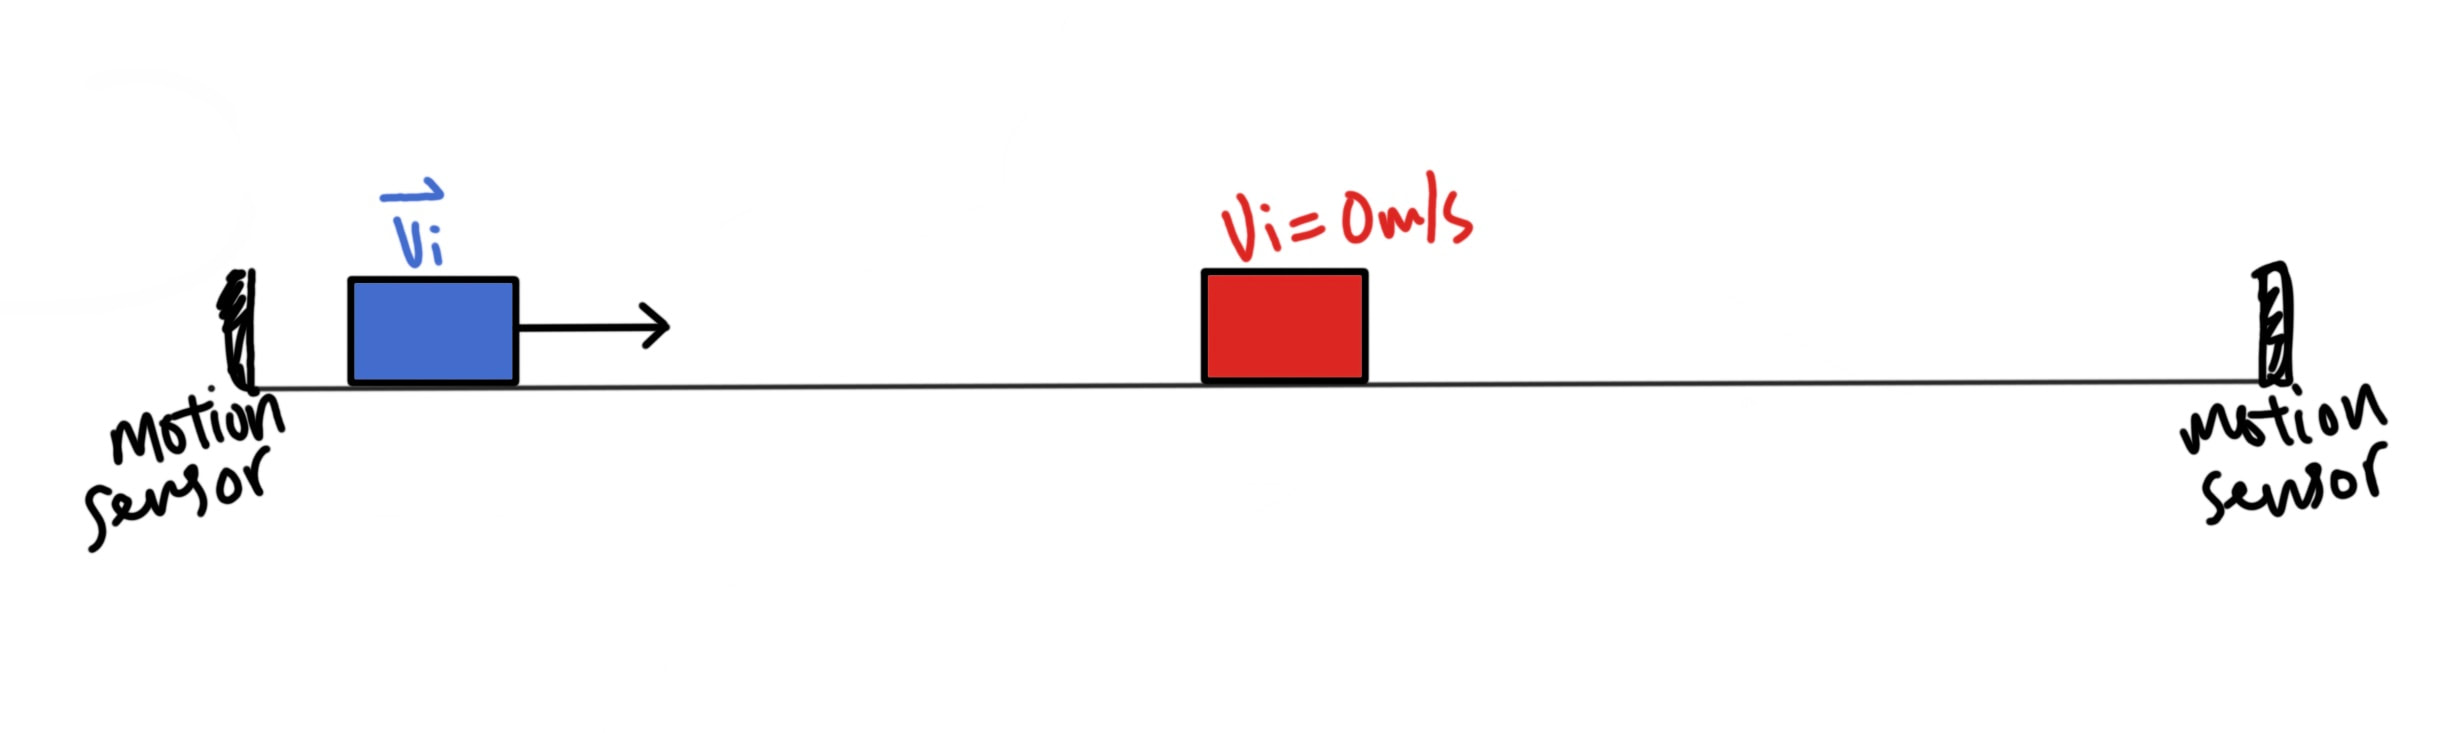
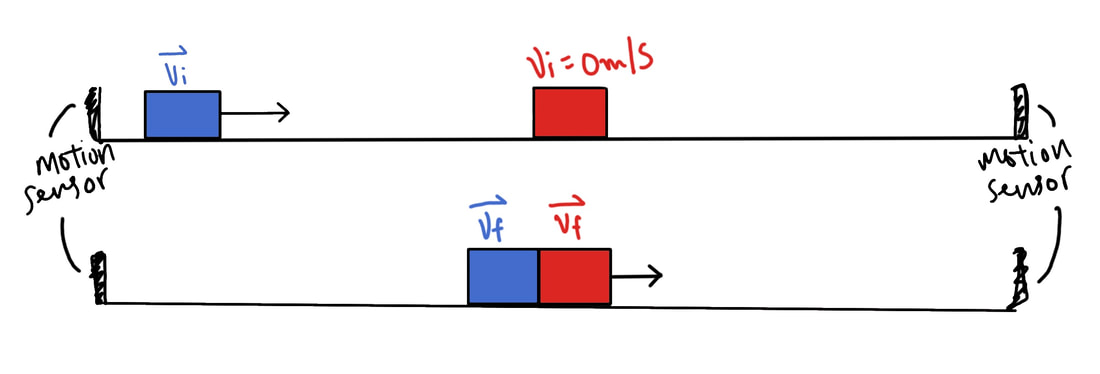
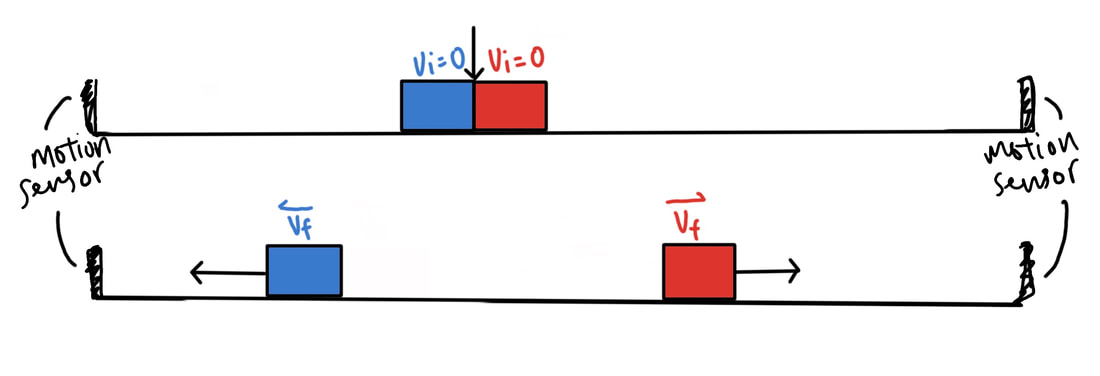
The blue car moves towards the red car (stationary). The blue car hits the red car, and they bounces off each other.
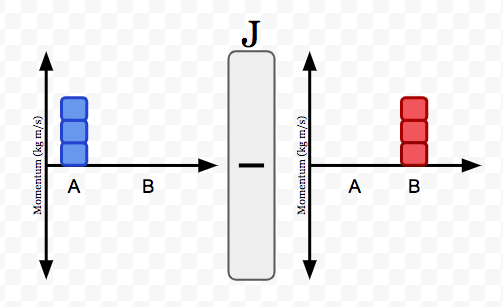
Momentum Bar Chart
|
Lab Description: The blue cart (A) starts off with a momentum in the positive direction, while the red cart (B) is sitting still on the track with no momentum. The blue car hits the red car, the red car starts moving in a positive direction with a momentum in the positive direction; meanwhile, the blue car stops moving. *No external impulse is added to the carts-track system, therefore J = 0 kg*m/s. |
Raw Data
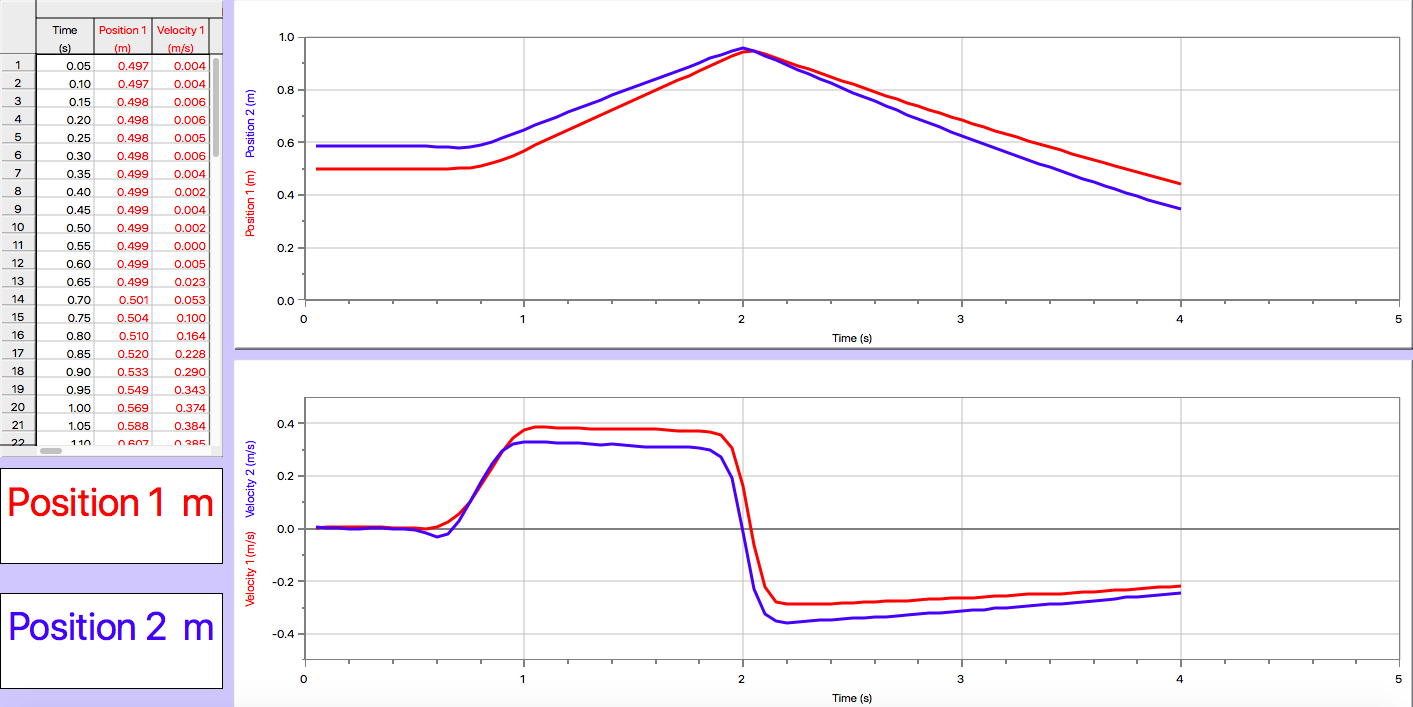
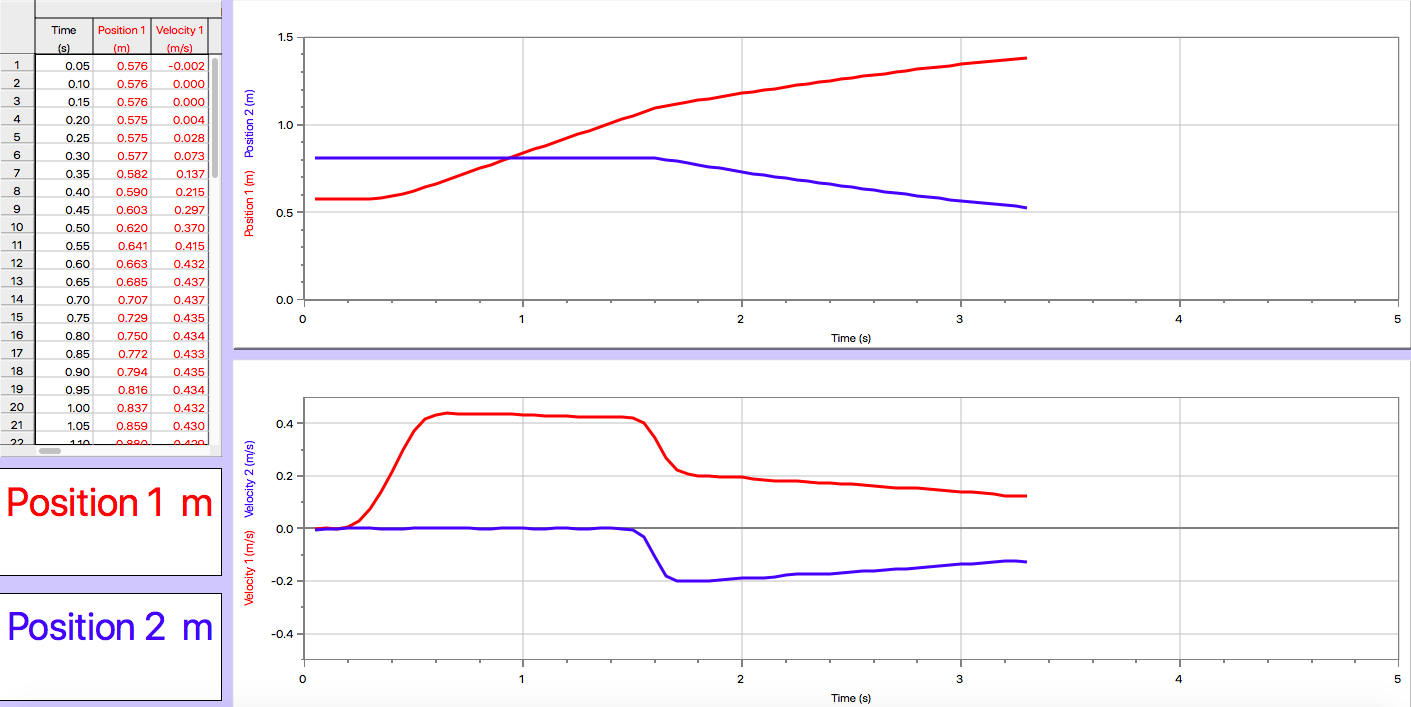
The following is the graphs recorded by the motion sensor on Logger Pro. Since we used two motions sensors on both ends, when looking at the red graph recording the position and velocity of the red car, the graphs need to be flipped to analyze the data.
The following is the graphs recorded by the motion sensor on Logger Pro. Since we used two motions sensors on both ends, when looking at the red graph recording the position and velocity of the red car, the graphs need to be flipped to analyze the data.
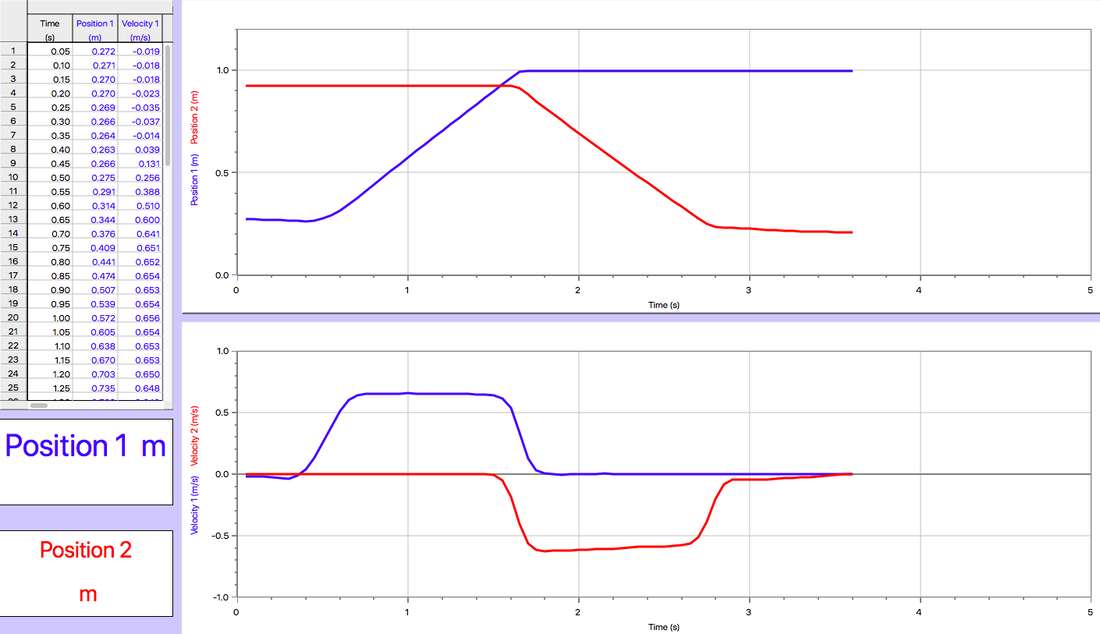
raw data graphs
|
Processed Data Next, we reorganize and consolidate the two graphs into one combined graph using Desmos. <link to graph> blue solid line --> position of Cart A red solid line --> position of Cart B blue dashed line --> velocity of Cart A red dashed line --> velocity of Cart B blue dotted line --> momentum of Cart A red dotted line --> momentum of Cart B purple solid line --> momentum of the system |
|
Calculations
Final Momentum = Mass * Vf = 0.252 kg * 0.60 m/s = 0.1512 kg*m/s
% Difference = |0.1663 - 0.1512| / 0.1663 = 9.09%
- pi(a) = pf(b)
- MVi(a) = MVf(b)
Final Momentum = Mass * Vf = 0.252 kg * 0.60 m/s = 0.1512 kg*m/s
% Difference = |0.1663 - 0.1512| / 0.1663 = 9.09%
Conclusion
The ultimate goal of this lab is to prove that momentum is conserved. If momentum is conserved, the total momentum of the system should be the same before and after the collision. In Scenario 1, based on the graphs and calculation, the initial momentum that Cart A started with is 0.1663 kg*m/s. After the collision, Cart A stops moving and Cart B starts to move with a momentum of 0.1512 kg*m/s. We yield a percent difference of 9.09%, which is relatively small. Therefore, we can conclude that momentum is proved to be conserved in Scenario 1. This concept is also proved in the Desmos graph that we created. Since the graph of total momentum is a straight line throughout the entire process of the lab, this indicates that the amount of momentum does not change and proves again that momentum is conserved.
The ultimate goal of this lab is to prove that momentum is conserved. If momentum is conserved, the total momentum of the system should be the same before and after the collision. In Scenario 1, based on the graphs and calculation, the initial momentum that Cart A started with is 0.1663 kg*m/s. After the collision, Cart A stops moving and Cart B starts to move with a momentum of 0.1512 kg*m/s. We yield a percent difference of 9.09%, which is relatively small. Therefore, we can conclude that momentum is proved to be conserved in Scenario 1. This concept is also proved in the Desmos graph that we created. Since the graph of total momentum is a straight line throughout the entire process of the lab, this indicates that the amount of momentum does not change and proves again that momentum is conserved.
Scenario 2 - Bouncy Collision (both moving)
Set-up
Set-up
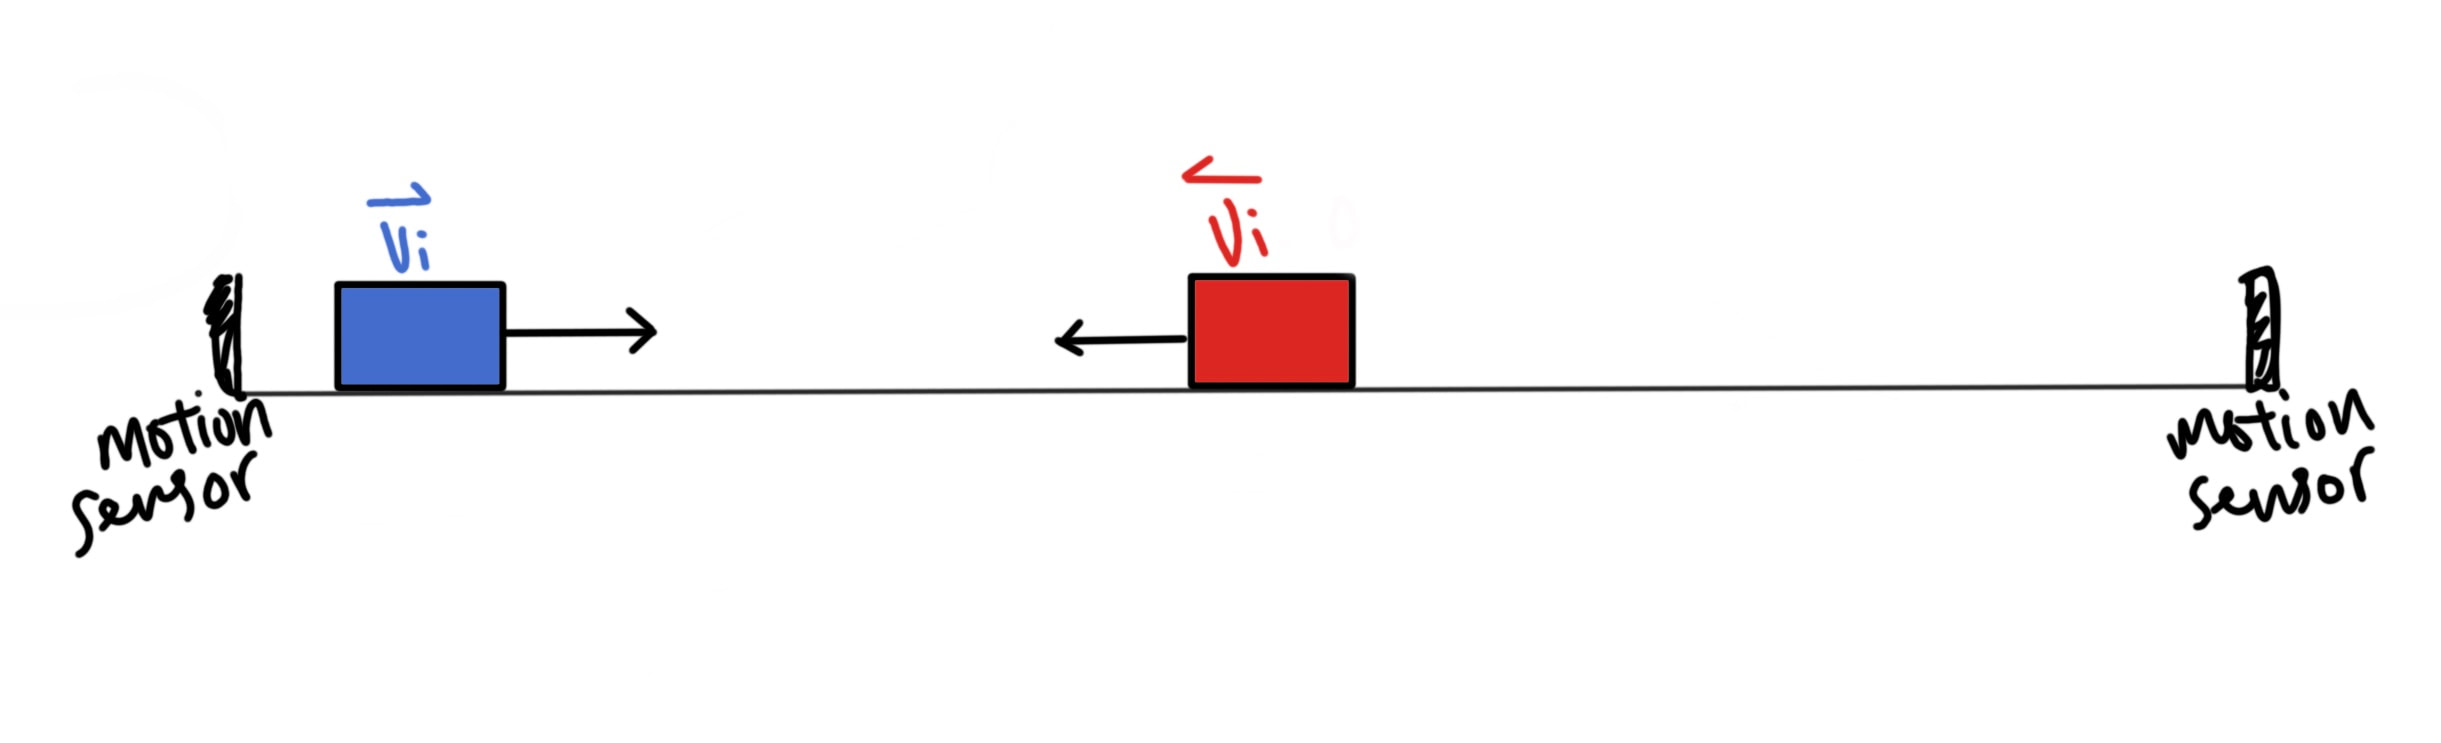
Both cars move towards each other on a track. Motion sensors collect data.
Momentum Bar Chart
|
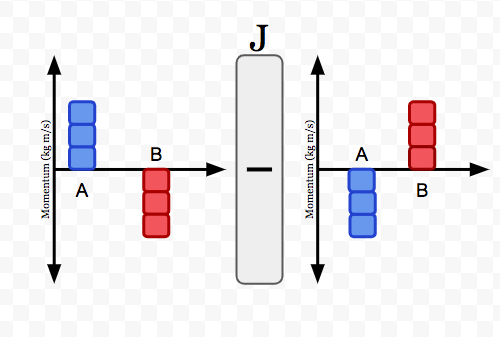
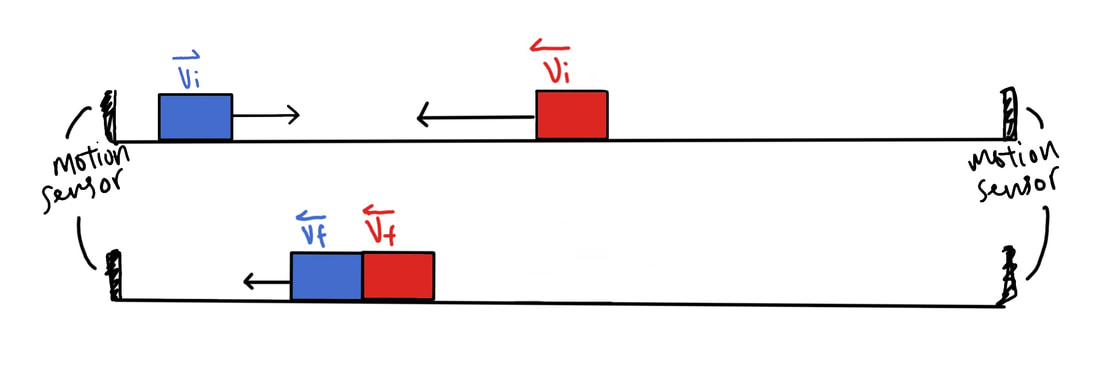
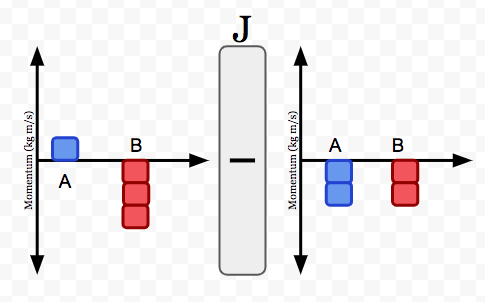
Lab Description: The blue cart (A) starts off moving in the positive direction, while the red cart (B) begins moving in the negative direction. Both carts keep traveling towards each other until they hit each other and then bounces off. After the collision both carts start to move towards the direction they came from. *No external impulse is added to the carts-track system, therefore J = 0 kg*m/s. |
Raw Data
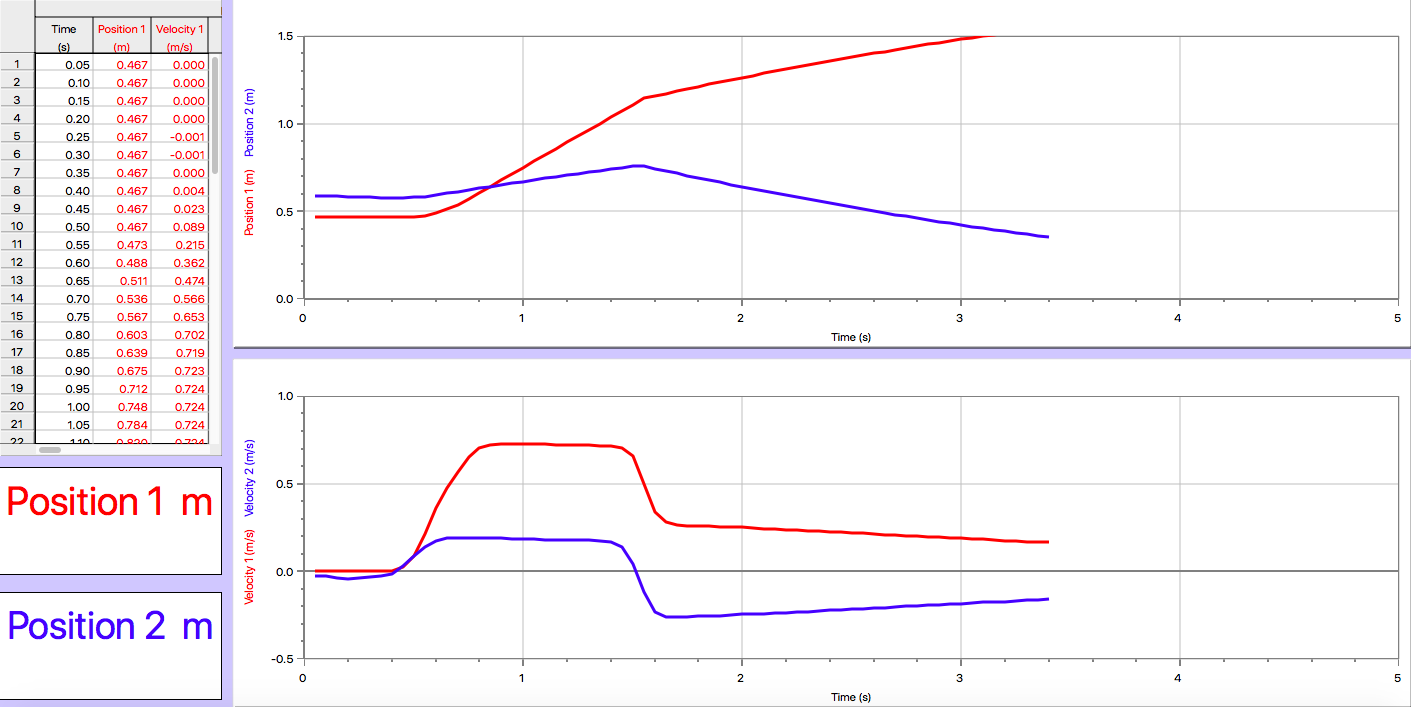
The following is the graphs recorded by the motion sensor on Logger Pro. Since we used two motions sensors on both ends, when looking at the red graph recording the position and velocity of the red car, the graphs need to be flipped to analyze the data.
raw data graphs
|
Processed Data Next, we reorganize and consolidate the two graphs into one combined graph using Desmos. <link to graph> blue solid line --> position of Cart A red solid line --> position of Cart B blue dashed line --> velocity of Cart A red dashed line --> velocity of Cart B blue dotted line --> momentum of Cart A red dotted line --> momentum of Cart B purple solid line --> momentum of the system |
|
Calculations
Final Momentum = Mass(a) * Vf(a) + Mass(b) * Vf(b)= 0.252 kg * (-0.35) m/s + 0.252 kg * (0.295) m/s= -0.01386 kg*m/s
% Difference = |- 0.0126 - (- 0.01386)| / 0.0126 = 10.0 %
- pi(a) +pi(b) = pf(a) + pf(b)
- MVi(a) +MVi(b) = MVf(a) + MVf(b)
Final Momentum = Mass(a) * Vf(a) + Mass(b) * Vf(b)= 0.252 kg * (-0.35) m/s + 0.252 kg * (0.295) m/s= -0.01386 kg*m/s
% Difference = |- 0.0126 - (- 0.01386)| / 0.0126 = 10.0 %
Conclusion
The ultimate goal of this lab is to prove that momentum is conserved. If momentum is conserved, the total momentum of the system should be the same before and after the collision. In Scenario 2, based on the graphs and calculation, the initial momentum of the system is (Cart A + Cart B) -0.0126 kg*m/s. After the collision, total momentum of the system is -0.01386 kg*m/s. We yield a percent difference of 10.0%, which is relatively small. Therefore, we can conclude that momentum is proved to be conserved in Scenario 2. This concept is also proved in the Desmos graph that we created. Since the graph of total momentum (purple solid line) is a straight line throughout the entire process of the lab, this indicates that the amount of momentum does not change and therefore proves again that momentum is conserved.
The ultimate goal of this lab is to prove that momentum is conserved. If momentum is conserved, the total momentum of the system should be the same before and after the collision. In Scenario 2, based on the graphs and calculation, the initial momentum of the system is (Cart A + Cart B) -0.0126 kg*m/s. After the collision, total momentum of the system is -0.01386 kg*m/s. We yield a percent difference of 10.0%, which is relatively small. Therefore, we can conclude that momentum is proved to be conserved in Scenario 2. This concept is also proved in the Desmos graph that we created. Since the graph of total momentum (purple solid line) is a straight line throughout the entire process of the lab, this indicates that the amount of momentum does not change and therefore proves again that momentum is conserved.
Scenario 3 - Sticky Collision (one moving, one stationary)
Set-up
Set-up
when the blue cart hits the red cart, the magnet between the carts will stick them together
Momentum Bar Chart
|
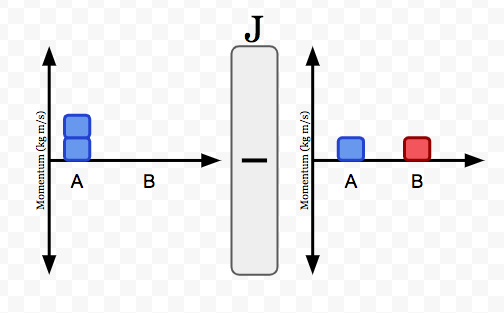
Lab Description: The blue cart (A) starts off moving in the positive direction, while the red cart (B) is sitting still on the track with no momentum. The blue car hits the red car, the two carts will be attached together by the magnets in between. After the collision, both Carts start moving in the positive direction with a positive momentum. *No external impulse is added to the carts-track system, therefore J = 0 kg*m/s. |
Raw Data
The following is the graphs recorded by the motion sensors on Logger Pro. Since we used two motions sensors on both ends, when looking at the following graphs, the colors of the graphs need to be switched in order to match the color of the graphs and the color of the carts.
raw data graphs
|
Processed Data Next, we reorganize and consolidate the two graphs into one combined graph using Desmos. <link to graph> blue solid line --> position of Cart A red solid line --> position of Cart B blue dashed line --> velocity of Cart A red dashed line --> velocity of Cart B blue dotted line --> momentum of Cart A red dotted line --> momentum of Cart B purple solid line --> momentum of the system |
|
Calculations
Final Momentum = Mass(a) * Vf(a) + Mass(b) * Vf(b)= 0.252 kg * 0.2 m/s + 0.252 kg * 0.2 m/s= 0.1008 kg*m/s
% Difference = |0.10836 - 0.1008| / 0.10836 = 6.98 %
- pi(b) = pf(a) + pf(b)
- MVi(b) = MVf(a) + MVf(b)
Final Momentum = Mass(a) * Vf(a) + Mass(b) * Vf(b)= 0.252 kg * 0.2 m/s + 0.252 kg * 0.2 m/s= 0.1008 kg*m/s
% Difference = |0.10836 - 0.1008| / 0.10836 = 6.98 %
Conclusion
The ultimate goal of this lab is to prove that momentum is conserved. If momentum is conserved, the total momentum of the system should be the same before and after the collision. In Scenario 3, based on the graphs and calculation, the initial momentum of the system is the initial momentum of Cart B, which is 0.1836 kg*m/s. After the collision, total momentum of the system is the sum of the momentum of Cart A and the momentum of Cart B, which is 0.1008 kg*m/s according to our calculation. We yield a percent difference of 6.98%, which is pretty small. Therefore, we can conclude that momentum is proved to be conserved in Scenario 3. This concept is also proved in the Desmos graph that we created. Since the graph of total momentum (purple solid line) is a almost straight line throughout the entire process of the lab, this indicates that the amount of momentum does not change significantly and therefore proves again that momentum is conserved.
The ultimate goal of this lab is to prove that momentum is conserved. If momentum is conserved, the total momentum of the system should be the same before and after the collision. In Scenario 3, based on the graphs and calculation, the initial momentum of the system is the initial momentum of Cart B, which is 0.1836 kg*m/s. After the collision, total momentum of the system is the sum of the momentum of Cart A and the momentum of Cart B, which is 0.1008 kg*m/s according to our calculation. We yield a percent difference of 6.98%, which is pretty small. Therefore, we can conclude that momentum is proved to be conserved in Scenario 3. This concept is also proved in the Desmos graph that we created. Since the graph of total momentum (purple solid line) is a almost straight line throughout the entire process of the lab, this indicates that the amount of momentum does not change significantly and therefore proves again that momentum is conserved.
Scenario 4 - Sticky Collision (both moving)
Set-up
Set-up
both carts are moving towards each other, when they collide, the magnets attach them together and they move together. Data is collected using two motion sensors
Momentum Bar Chart
|
Lab Description:
The blue cart (A) starts off moving in the positive direction, while the red cart (B) begins traveling with a negative velocity. In this particular setup, the Cart B has a greater speed than Cart A. Both cars are traveling towards each other until they collide. When the carts collide, the magnet between the carts will attach them together, and therefore, after the collision, two carts will be moving in the negative direction together with the same amount of momentum. *No external impulse is added to the carts-track system, therefore J = 0 kg*m/s. |
Raw Data
The following is the graphs recorded by the motion sensor on Logger Pro. Since we used two motions sensors on both ends, when looking at the red graph recording the position and velocity of the red car, the graphs need to be flipped to analyze the data.
The following is the graphs recorded by the motion sensor on Logger Pro. Since we used two motions sensors on both ends, when looking at the red graph recording the position and velocity of the red car, the graphs need to be flipped to analyze the data.
raw data graphs
|
Processed Data Next, we reorganize and consolidate the two graphs into one combined graph using Desmos. <link to graph> blue solid line --> position of Cart A red solid line --> position of Cart B blue dashed line --> velocity of Cart A red dashed line --> velocity of Cart B blue dotted line --> momentum of Cart A red dotted line --> momentum of Cart B purple solid line --> momentum of the system |
|
Calculations
Final Momentum = Mass(a) * Vf(a) + Mass(b) * Vf(b)= 0.252 kg * (-0.26) m/s + 0.252 kg * (-0.26) m/s= -0.13104 kg*m/s
% Difference = |-0.13608 - (- 0.13104)| / 0.13608 = 3.7 %
- pi(a) + pi(b) = pf(a) + pf(b)
- MVi(a) + MVi(b) = MVf(a) + MVf(b)
Final Momentum = Mass(a) * Vf(a) + Mass(b) * Vf(b)= 0.252 kg * (-0.26) m/s + 0.252 kg * (-0.26) m/s= -0.13104 kg*m/s
% Difference = |-0.13608 - (- 0.13104)| / 0.13608 = 3.7 %
Conclusion
The ultimate goal of this lab is to prove that momentum is conserved. If momentum is conserved, the total momentum of the system should be the same before and after the collision. In Scenario 4, based on the graphs and calculation, the initial momentum of the system is (pi(a) + pi(b)) -0.13608 kg*m/s. After the collision, the carts are attached together, so both carts will have the same momentum, the total final momentum of the system is -0.13104 kg*m/s based on our calculation. We yield a percent difference of 3.7%, which is very small, meaning our data is actually very accurate. Therefore, we can conclude that momentum is proved to be conserved in Scenario 4. This concept is also proved in the Desmos graph that we created. Since the graph of total momentum (purple solid line) is very close to a straight line throughout the entire process of the lab, this indicates that the amount of momentum does not change and therefore proves again that momentum is conserved.
The ultimate goal of this lab is to prove that momentum is conserved. If momentum is conserved, the total momentum of the system should be the same before and after the collision. In Scenario 4, based on the graphs and calculation, the initial momentum of the system is (pi(a) + pi(b)) -0.13608 kg*m/s. After the collision, the carts are attached together, so both carts will have the same momentum, the total final momentum of the system is -0.13104 kg*m/s based on our calculation. We yield a percent difference of 3.7%, which is very small, meaning our data is actually very accurate. Therefore, we can conclude that momentum is proved to be conserved in Scenario 4. This concept is also proved in the Desmos graph that we created. Since the graph of total momentum (purple solid line) is very close to a straight line throughout the entire process of the lab, this indicates that the amount of momentum does not change and therefore proves again that momentum is conserved.
Scenario 5 - "Explosion" (neither is moving, then both are moving)
Set-up
Set-up
both carts are attached together at first, press the button to cause the "explosion". Two motion sensors are used to collect data
Momentum Bar Chart
|
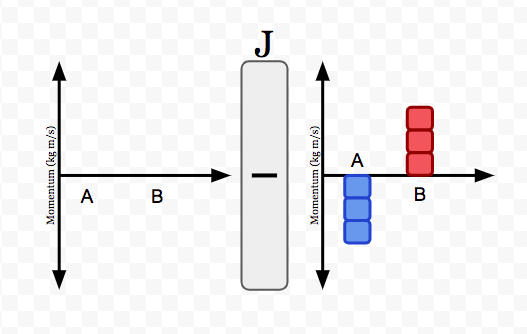
Lab Description: To start with, both carts are stationary in the middle of the track. The carts are connected by a button. If you press on the button and release the carts, the carts are going to start traveling away from each other with the same speed in opposite directions. In this scenario, the system starts with no momentum. *No external impulse is added to the carts-track system, therefore J = 0 kg*m/s. |
Raw Data
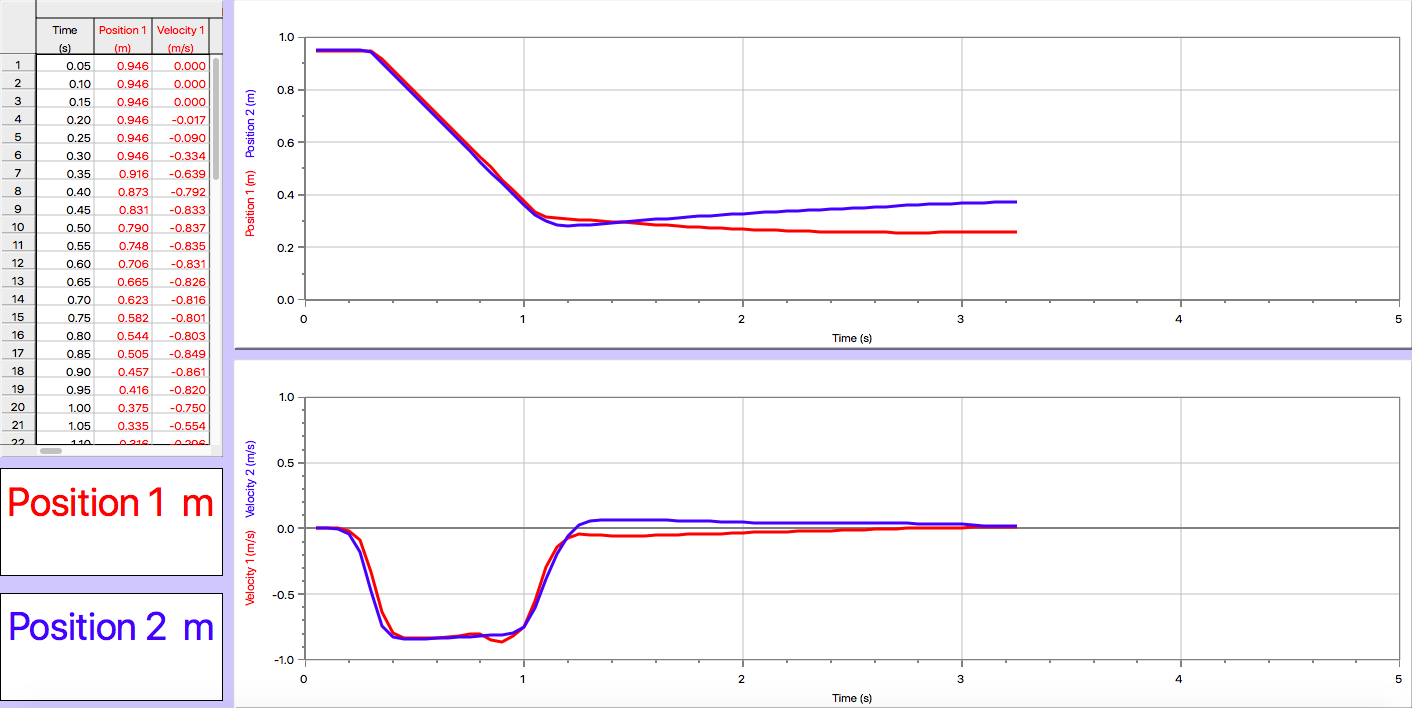
The following is the graphs recorded by the motion sensor on Logger Pro. Since we used two motions sensors on both ends, when looking at the red graph recording the position and velocity of the red car, the graphs need to be flipped to analyze the data.
raw data graphs
|
Processed Data Next, we reorganize and consolidate the two graphs into one combined graph using Desmos. <link to graph> blue solid line --> position of Cart A red solid line --> position of Cart B blue dashed line --> velocity of Cart A red dashed line --> velocity of Cart B blue dotted line --> momentum of Cart A red dotted line --> momentum of Cart B purple solid line --> momentum of the system |
|
Calculations
Final Momentum = Mass(a) * Vf(a) + Mass(b) * Vf(b)= 0.252 kg * (-0.82) m/s + 0.252 kg * 0.82 m/s= 0 kg*m/s
% Difference = |0 - 0| / 0 = 0 %
- 0 kg*m/s = pf(a) + pf(b)
- - pf(a) = pf(b)
- - MVf(a) = MVf(b)
Final Momentum = Mass(a) * Vf(a) + Mass(b) * Vf(b)= 0.252 kg * (-0.82) m/s + 0.252 kg * 0.82 m/s= 0 kg*m/s
% Difference = |0 - 0| / 0 = 0 %
Conclusion
The ultimate goal of this lab is to prove that momentum is conserved. If momentum is conserved, the total momentum of the system should be the same before and after the collision. In Scenario 5, based on the graphs and calculation, the system starts with a momentum of 0 kg*m/s, which makes sense because both nothing in the system is moving so there is no momentum. After the carts are released from the attachment, the carts start to move in opposite directions with the exact same speed. This results in the fact that the total momentum of the system will remain 0 kg*m/s because the two momentums have the same magnitude but different in directions. This is a very confident conclusion so we can say that our percent difference is 0%. When we look at the combined graph on Desmos, the momentum V.S. time graph (purple solid line) lays on the x-axis throughout the entire lab process. Therefore, we can conclude that momentum is proved to be conserved in Scenario 5.
The ultimate goal of this lab is to prove that momentum is conserved. If momentum is conserved, the total momentum of the system should be the same before and after the collision. In Scenario 5, based on the graphs and calculation, the system starts with a momentum of 0 kg*m/s, which makes sense because both nothing in the system is moving so there is no momentum. After the carts are released from the attachment, the carts start to move in opposite directions with the exact same speed. This results in the fact that the total momentum of the system will remain 0 kg*m/s because the two momentums have the same magnitude but different in directions. This is a very confident conclusion so we can say that our percent difference is 0%. When we look at the combined graph on Desmos, the momentum V.S. time graph (purple solid line) lays on the x-axis throughout the entire lab process. Therefore, we can conclude that momentum is proved to be conserved in Scenario 5.
Uncertainties...
- When estimating the slopes/values of the graphs using Logger Pro, the numbers are difference each time depending on what domain and range you are estimating. Also, since the numbers are very small, it is possible to be off by a little when approximating the slopes.
- We are ignoring friction between the carts and the track for all scenarios. Even though there is barely friction between the surfaces, a small part of energy will still be lost to the environment, resulting in a decrease in the speed, which will ultimately affect the momentum of the object.
- Finally, since the numbers we get always have many decimal places, we usually round our data to a shorter number, therefore, when doing further calculations, we are not using the exact values we got. This can also be a reason for getting off a little bit.
Widget is loading comments...
